go作为现代高级编程语言,无须程序员关心内存申请和释放,降低了入门门槛,但也导致很多水平良莠不齐的人写出很多不好的代码,导致服务出现各种各样不稳定的情况。如大对象的频繁申请和释放、协程泄露、指针断言反射的乱用等等。 虽然说代码是屎山,但是在服务尚且能用的情况下,架构师肯定没有精力来调教每行代码,这时候就可以通过pprof从宏观层面把脉服务的运行情况,从而找出那些脑残的代码来优化。
无论是用gin,还是go-zero, 亦或者net/http, 接入pprof都十分简单,只需要将pprof的几个handle函数注册到web框架的route里面即可,我们以go-zero为例
先定义一个profile.go文件
go
package profile

import (
	"github.com/zeromicro/go-zero/rest"
	"net/http"
	"net/http/pprof"
)

func wrapH(h http.Handler) http.HandlerFunc {
	return func(ResponseWriter http.ResponseWriter, Request *http.Request) {
		h.ServeHTTP(ResponseWriter, Request)
	}
}

func ProfileRoutes() []rest.Route {
	pprofRoutes := make([]rest.Route, 0)
	pprofRoutes = append(pprofRoutes, rest.Route{
		Method:  http.MethodGet,
		Path:    "/debug/pprof/",
		Handler: pprof.Index,
	})
	pprofRoutes = append(pprofRoutes, rest.Route{
		Method:  http.MethodGet,
		Path:    "/debug/pprof/cmdline",
		Handler: pprof.Cmdline,
	})
	pprofRoutes = append(pprofRoutes, rest.Route{
		Method:  http.MethodGet,
		Path:    "/debug/pprof/profile",
		Handler: pprof.Profile,
	})
	pprofRoutes = append(pprofRoutes, rest.Route{
		Method:  http.MethodGet,
		Path:    "/debug/pprof/symbol",
		Handler: pprof.Symbol,
	})
	pprofRoutes = append(pprofRoutes, rest.Route{
		Method:  http.MethodPost,
		Path:    "/debug/pprof/symbol",
		Handler: pprof.Symbol,
	})
	pprofRoutes = append(pprofRoutes, rest.Route{
		Method:  http.MethodGet,
		Path:    "/debug/pprof/trace",
		Handler: pprof.Trace,
	})
	pprofRoutes = append(pprofRoutes, rest.Route{
		Method:  http.MethodGet,
		Path:    "/debug/pprof/goroutine",
		Handler: wrapH(pprof.Handler("goroutine")),
	})
	pprofRoutes = append(pprofRoutes, rest.Route{
		Method:  http.MethodGet,
		Path:    "/debug/pprof/heap",
		Handler: wrapH(pprof.Handler("heap")),
	})
	pprofRoutes = append(pprofRoutes, rest.Route{
		Method:  http.MethodGet,
		Path:    "/debug/pprof/block",
		Handler: wrapH(pprof.Handler("block")),
	})
	pprofRoutes = append(pprofRoutes, rest.Route{
		Method:  http.MethodGet,
		Path:    "/debug/pprof/mutex",
		Handler: wrapH(pprof.Handler("mutex")),
	})
	pprofRoutes = append(pprofRoutes, rest.Route{
		Method:  http.MethodGet,
		Path:    "/debug/pprof/threadcreate",
		Handler: wrapH(pprof.Handler("threadcreate")),
	})
	pprofRoutes = append(pprofRoutes, rest.Route{
		Method:  http.MethodGet,
		Path:    "/debug/pprof/allocs",
		Handler: wrapH(pprof.Handler("allocs")),
	})

	return pprofRoutes
}
之后在main中将这些routes加到server里面
go
func main() {
	...

	server := rest.MustNewServer(restConf)
	defer server.Stop()

	gen.Register(server)


	// profile 性能分析
	server.AddRoutes(profile.ProfileRoutes(), rest.WithTimeout(time.Second*35))

	server.Start()
}
这样程序启动之后就可以通过go tool pprof命令去在浏览器中查看服务的cpu、堆栈、协程的运行情况。
bash
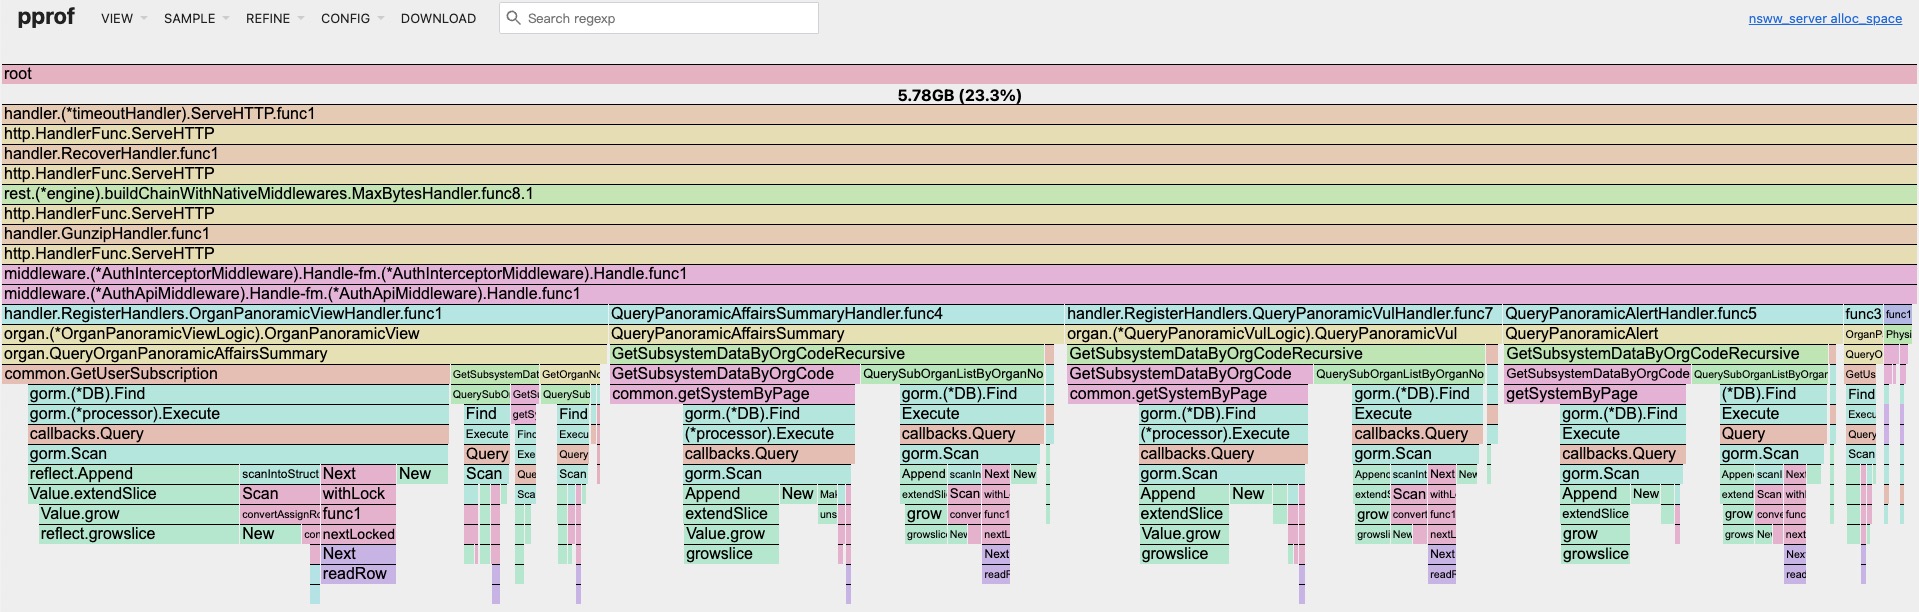
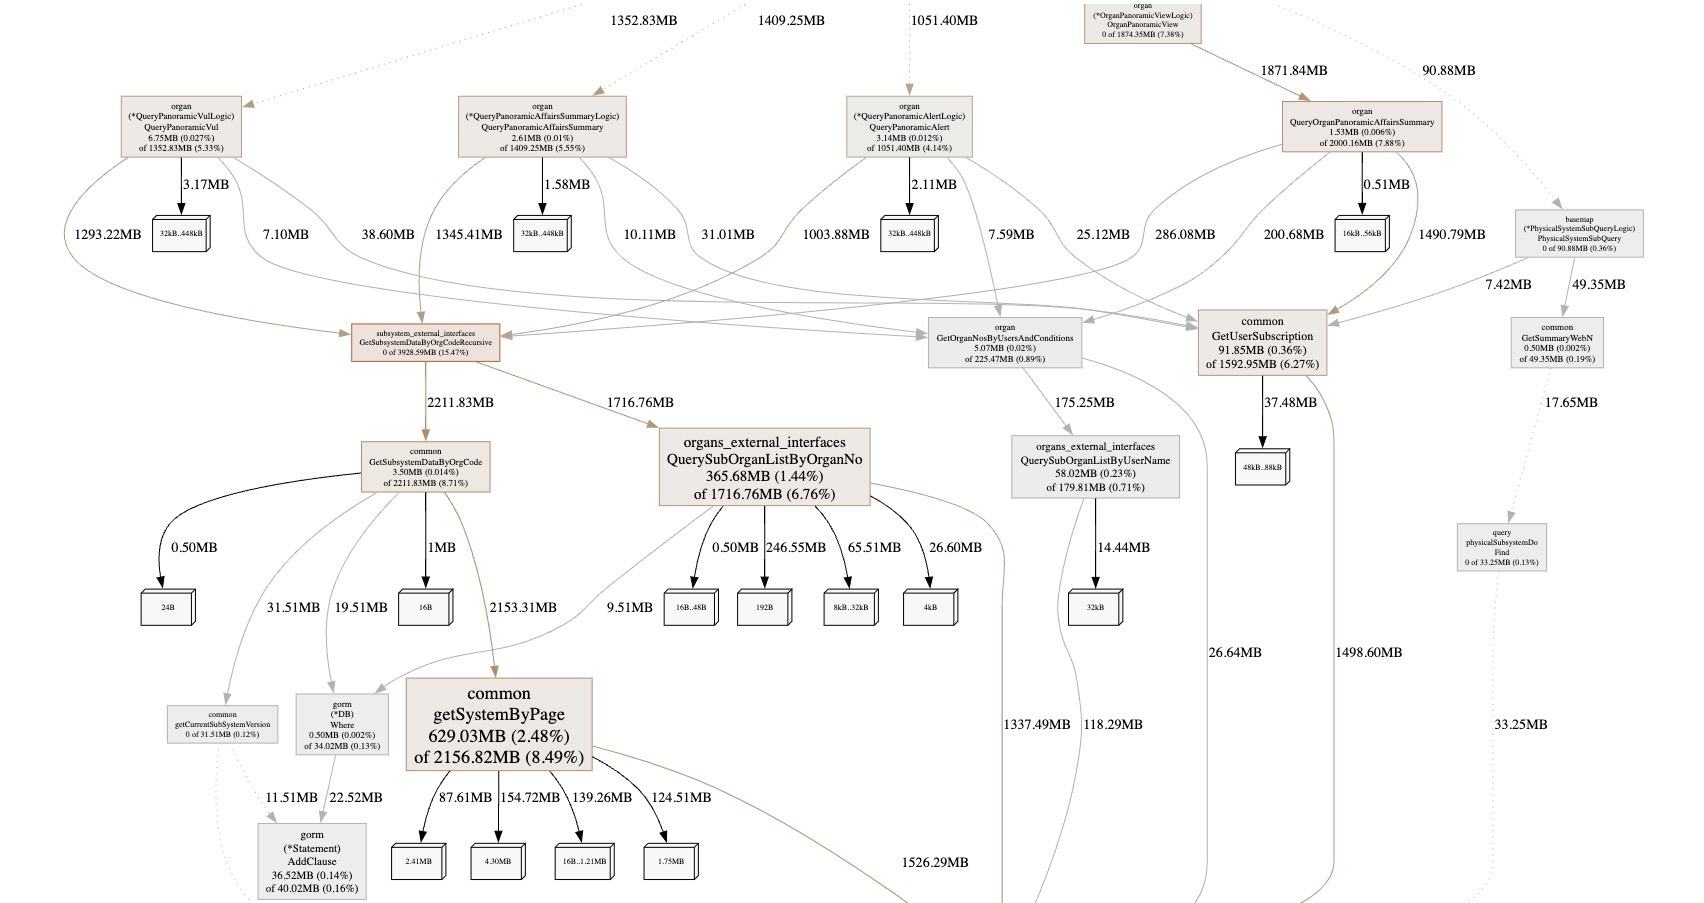
go tool pprof -http=:1234 http://$server_ip:$server_port/debug/pprof/allocs请确保自己的机器装了graphviz,这样就可以在浏览器中以图的方式来快速定位问题,以macos为例:
bash
brew install graphviz